
OUR JOURNEY

Why food matters!
Right now, our little earth is feeling pretty rough. It’s being pushed to its limits – what the scientists call ‘planetary boundaries’.
You might be amazed to know just how...
Greedy global food production can be. It pumps out a third² of all CO2 emissions, gobbles up half of all the habitable land³, glugs 70% of freshwater use⁴ and 78% of global ocean¹. And agriculture is the main driver behind the habitat loss of 80% of threatened birds and mammal species⁵.
¹Reducing food’s environmental impacts through producers and consumers. J. Poore & T. Nemecek, 2018 ²Food systems are responsible for a third of global anthropogenic GHG emissions. Crippa, M., Solazzo, E., Guizzardi, D. et al. Nat Food 2, 198–209 (2021). ³Anthropogenic transformation of the biomes, 1700 to 2000. Ellis, E. C., Klein Goldewijk, K., Siebert, S., Lightman, D., & Ramankutty, N. (2010). Global Ecology and Biogeography, 19(5), 589-606. & FAOSTAT, combined by OneWorldData ⁴Global environmental and nutritional assessment of national food supply patterns: Insights from a data envelopment analysis approach. E. Lucas, A. Galan-Martin. 2020 ⁵Future threats to biodiversity and pathways to their prevention. D.Tilman, M. Clark 2018
GOOD FOOD STARTS WITH GOOD INGREDIENTS
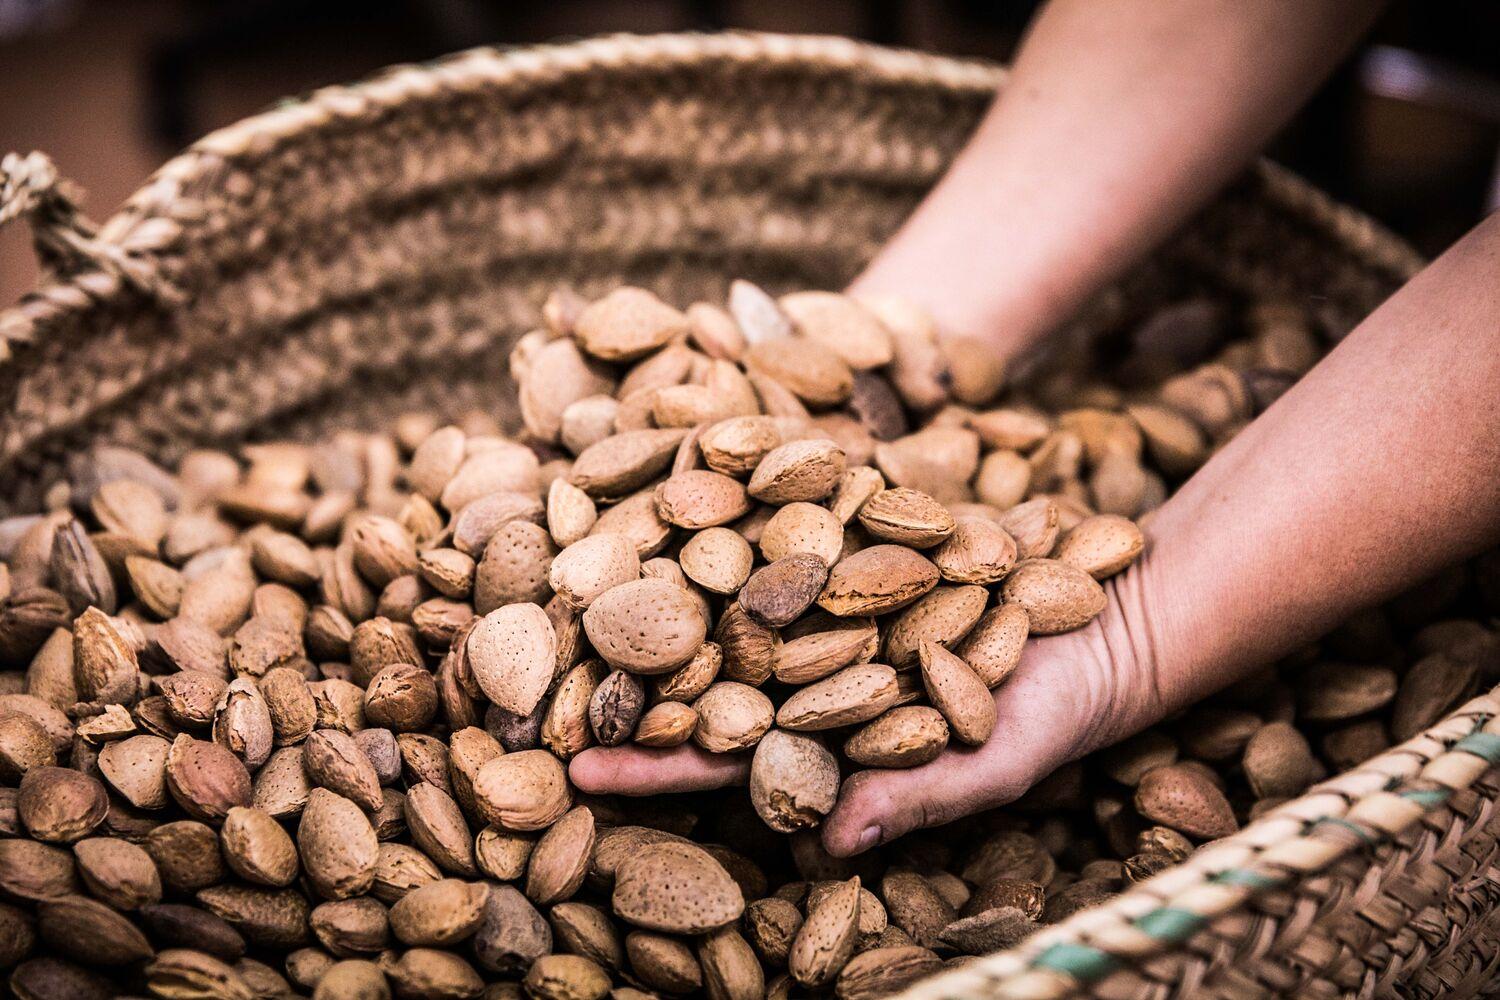
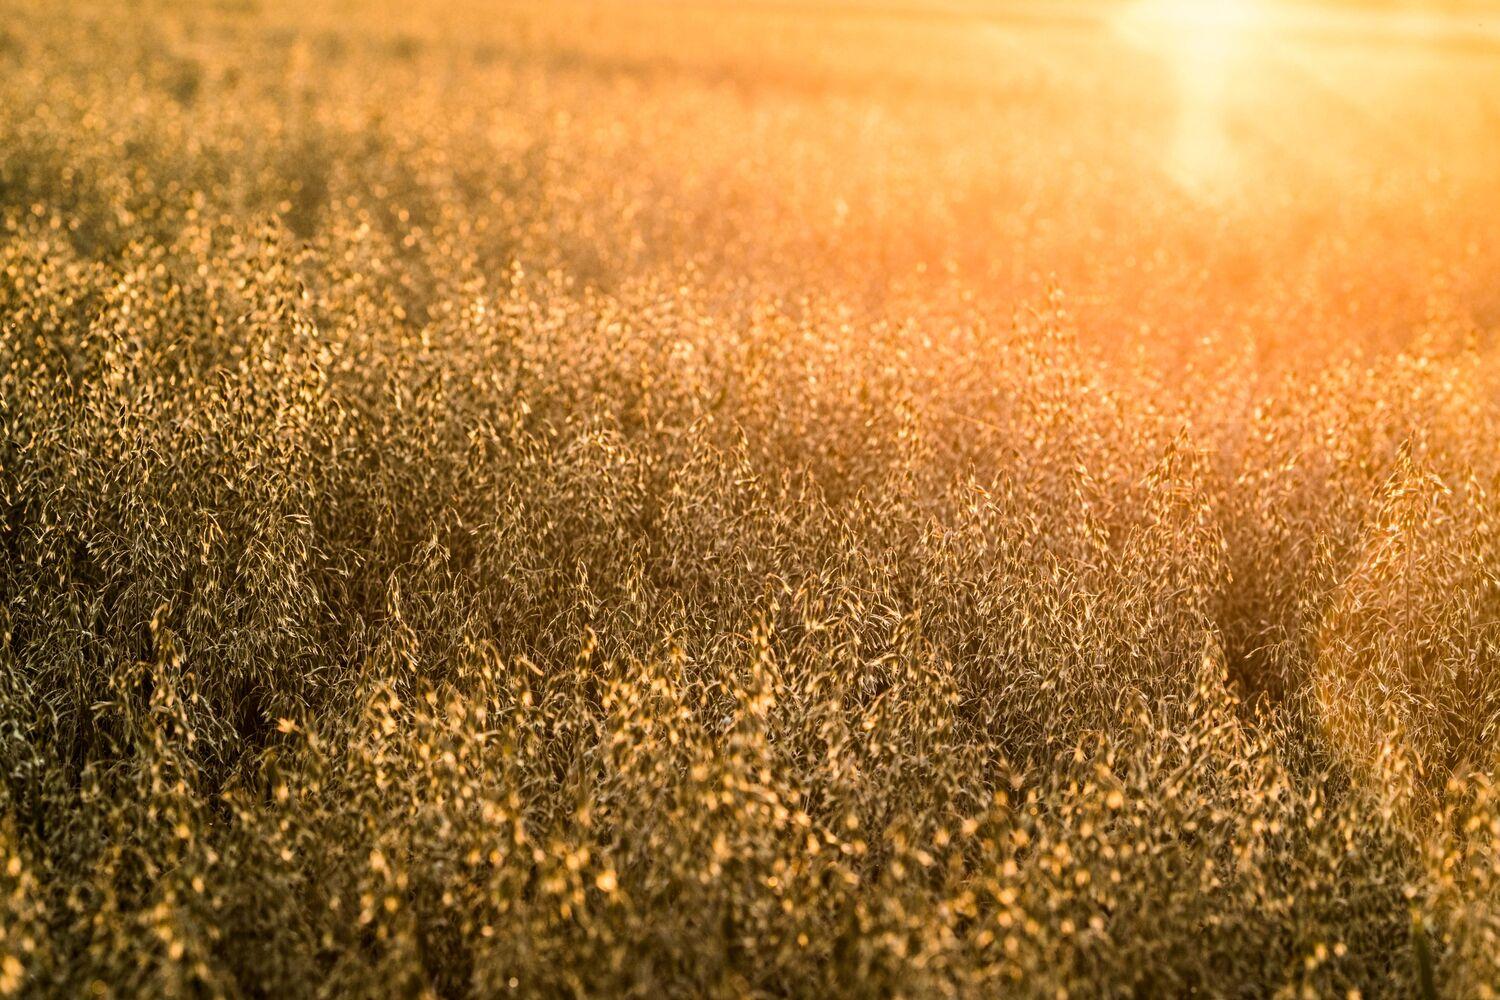
We use European oats and almonds. And our soya is partly from Europe too.

Between 2020 and 2024, we cut our operations footprints by 65% for water in Wevelgem (Belgium) site and by 17% in Kettering (UK) site*.
*Water consumption per finished products in operation. Audited reporting in Greentrack (UL EHS Sustainability).
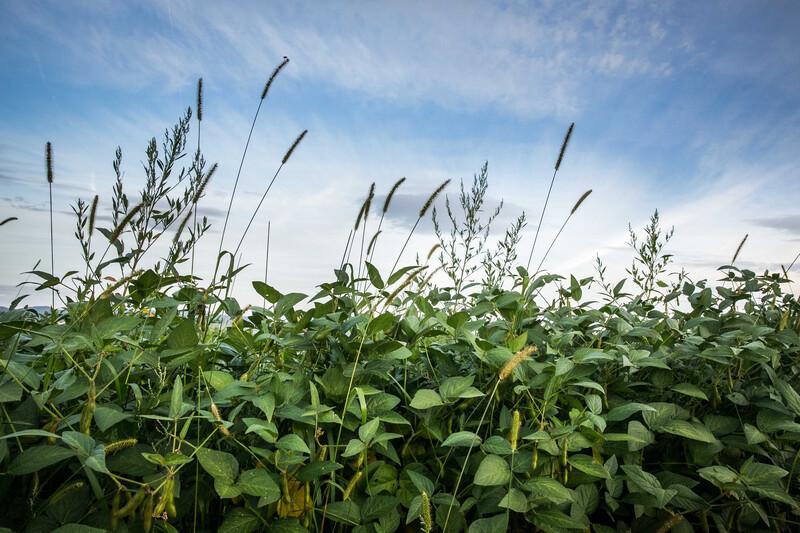

Learn more about our ingredients
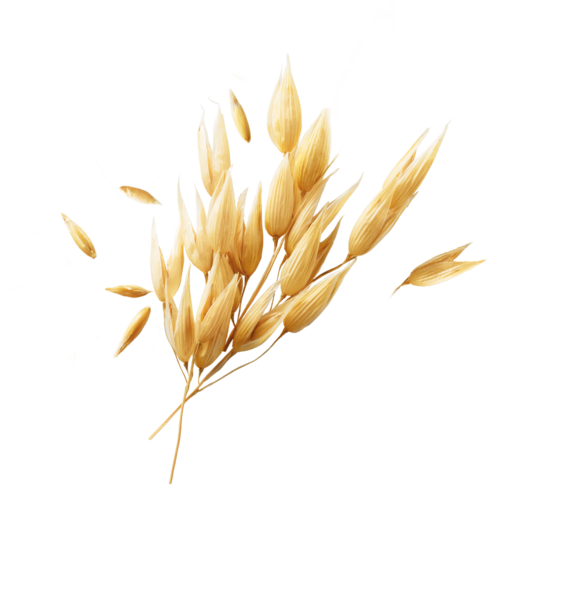
We’re proud to share that our Alpro Oat Original and Oat No Sugars 1L drinks are now made using 100% British oats — with most sourced from farms within just 80 miles of the mill. That means fewer food miles and more support for local farmers. But it’s not just about where our oats come from — it’s also about how we make our drinks. Thanks to this switch to local sourcing, along with a new recipe and updated production process, we've delivered a: 25% lower carbon footprint 20% less land use 70% less water use. All measured across the full product lifecycle, compared to our previous UK recipes for these drinks. Where has this data come from? In 2025, we partnered with Foodsteps to carry out a cradle-to-grave comparative life cycle assessment. This assessment followed internationally recognised standards — ISO 14044 and ISO 14067 — and used primary data where possible (from our own supply chain) along with high-quality UK/EU secondary data where needed. The results were critically reviewed to ensure accuracy and transparency.